Data visualization is nothing new! It has been here for millions of years. If you disagree with me, you can visit the mountain caves where pre-historic humans painted their journeys on the cave wall. Since then, every artist has canvassed their thoughts through various means. But, then the game changed as we saw the explosion of information building around the core sciences such as Mathematics, Statistics and Astronomy. The curiosity to understand these sciences led to the development of modern Data Visualization techniques.
What is Data Visualization?
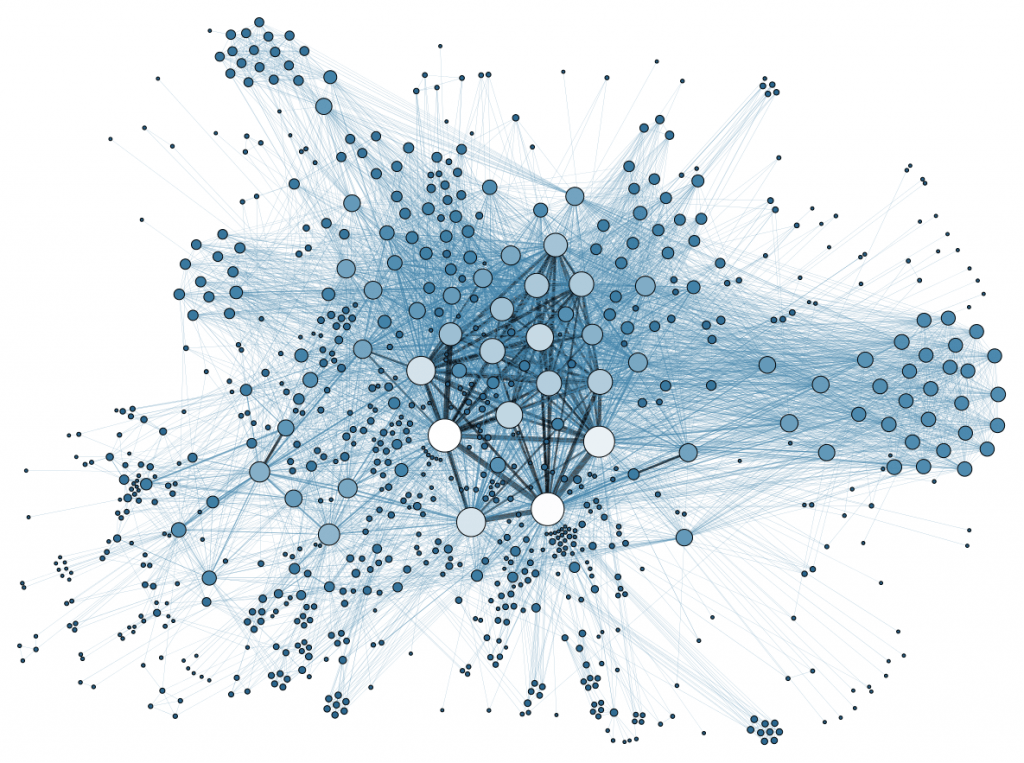
Data Visualization is simply defined as the visual representation of any data or related information in the form of graphs, bars, pie-charts and heatmaps.
In this article, you will clearly understand why data visualization training plays a key role in turning any challenge into an opportunity.
Here are some of the ways how data visualization impacts the growth of businesses.

Quick Representation of Data
Humans tend to process visual data faster than text ones. The use of chart, graphs and other visualization techniques can be leveraged to accurately project and understand various data types. Modern data visualization technology providers such as SAS and Tableau Software can analyze thousands of data points and convert them into excellent human-friendly visualizations within seconds.
Business Intelligence, Shared with all Departments
Not long ago, only a handful of people within the organizations had Business Intelligence tools. Today, every department within an organization can build their own BI stack using Data Visualization techniques. Marketing and Sales teams are leveraging these visualization tools to find their audience groups, design their budgets, plan to forecast and even measure the performance of their projects.
Other key departments such as Customer service, Human Resources, Logistics and Compliance are also heavily investing into these techniques to provide a well-rounded organizational development.
Securing Opportunities in Emerging Markets
Every day, you have a new competitor in the market that has a better product and a better customer experience. How to compete with such competitors? Modern businesses leverage Predictive Intelligence to beat such competition. Together with Business Intelligence, Competitor analytics can be best understood using Data visualization techniques. One such example is the use of various smartphones in a particular location.
Telecom companies leverage heatmaps and location data to find which set of customers are using a particular device on their network. Similarly, the pin graphs you see on Travel and Trip planners that show you the cheapest hotel rates are also built on Data Visualization platforms.
Conflict-Free Resolution Using Data and Analytics
Businesses can quickly grow with employees who can accurately communicate their ideas without conflicting thoughts. Data Visualization provides that platform to every team and every department.
If you are curious to polish your employability skills, you can learn key trends from a data visualization training course.
Do you have a passion for writing? Do you have opinions and experiences you want to share with the world? Come onboard and write for us Education! We’re eager to hear what you have to say! We have readers looking for the latest news and the hottest gossip. Set the page on fire with your pen and enthrall us.